Optical interband absorption in a quantum well including excitonic effects
This tutorial presents calculation of interband absorption spectrum in a quantum well including excitonic effects.
There is a separate tutorial that discusses the calculation of the exciton binding energy and exciton Bohr radius of an infinite quantum well: Exciton energy in quantum wells - Tutorial
In this tutorial we calculate the absorption spectrum of a 10 nm GaAs quantum well. The purpose is to calculate the absorption spectrum for a simple model and model that includes excitonic effects on the absorption spectrum.
The absorption spectrum has been calculated using a simple model assuming a parabolic energy dispersion. In order to keep things simple, i.e. to be able to compare our results with analytical formula, we used the same effective mass for electrons and holes (\(m_{\rm e} = m_{\rm h} = 0.065~m_{\rm 0}\)).
The excitonic binding energy \(E_{\rm b}\) has been calculated to be -9.5 meV. Therefore, the absorption spectrum that includes excitonic contributions starts at an energy roughly 10 meV below than band gap. The exciton Bohr radius \(\lambda\) was found to be 13.1 nm.
For Lorentzian broadening we use a linewidth of FWHM = 6 meV, and for Gaussian broadening we use FWHM = 10 meV. The FWHM(Voigt) depends in a complicated way on FWHM(Lorentzian) and FWHM(Gaussian).
Property |
Symbol |
unit |
analytical calculation |
nextnano |
|
|---|---|---|---|---|---|
quantum well width |
L |
nm |
10.0 |
10.0 |
|
barrier height |
E b |
eV |
infinite quantum well model |
1000 |
|
effective electron mass |
me |
m0 |
0.0665 |
0.0665 |
|
effective hole mass |
mh |
m0 |
0.0665 |
0.0665 |
|
refractive index |
nr |
3.3 |
3.3 |
||
linewidth (FWHM) Lorentzian |
\(\Gamma_{\rm L}\) |
meV |
n/a |
6 |
|
linewidth (FWHM) Gaussian |
\(\Gamma_{\rm G}\) |
meV |
n/a |
10 |
|
temperature |
T |
K |
300 |
300 |
|
The Coulomb enhancement factor is given by \(S_{\rm 2D}=\frac{\exp \left(\pi/\sqrt{\Delta}\right)}{\cosh \left(\pi/\sqrt{\Delta}\right)}\), where \(\Delta\) is the total excess kinetic energy of the electron–hole pair normalized to \(E_{\rm b}/4\) [LeverJLT2010].
We observe two major contributions to the absorption spectrum:
A distinct peak a few meV (corresponding to the exciton binding energy \(E_{\rm b}\)) lower than the absorption edge (band gap). This is the signature of the bound exciton.
Sommerfeld enhancement: In the continuum part of the absorption spectrum, it is scaled via the Coulomb enhancement factor \(S_{\rm 2D}\).
— Begin —
Automatic documentation: Running simulations, generating figures and reStructured Text (*.rst) using nextnanopy
The following documentation and figures were generated automatically using nextnanopy.
The following Python script was used: 1D_InterbandAbsorption_InfiniteWell_Exciton_nextnano3.py
The following figures have been generated using nextnano³.
The absorption spectrum has been calculated using a simple model assuming a parabolic energy dispersion.
Infinite QW (single-band)
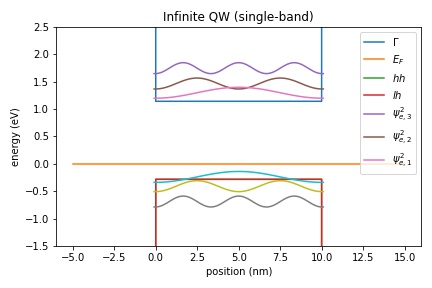
Figure 2.5.8 Conduction and valence band edges, Fermi level, electron and holes states of a quantum well
Optical absorption spectrum of bulk crystal and of a quantum well
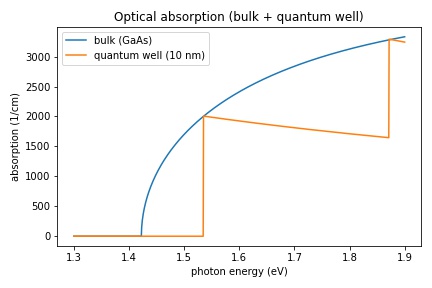
Figure 2.5.9 The absorption spectrum of bulk GaAs and a 10 nm infinite quantum well.
Optical absorption of a 10 nm quantum well
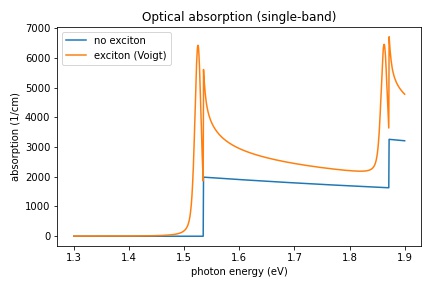
Figure 2.5.10 The absorption spectrum of a 10 nm infinite quantum well consisting of GaAs. The absorption spectrum has been calculated with and without excitonic contributions to the spectrum.
Optical absorption of a 10 nm quantum well using different broadening functions
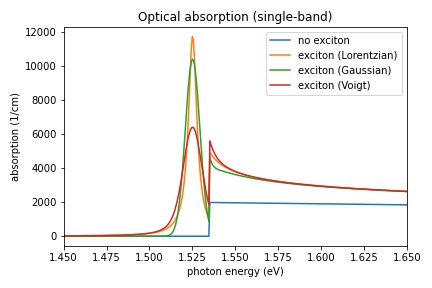
Figure 2.5.11 The absorption spectrum of a 10 nm infinite quantum well consisting of GaAs. The absorption spectrum has been calculated with Lorentzian, Gaussian and Voigt broadening function, and without excitonic contributions to the spectrum.
Optical absorption of a 10 nm quantum well showing the different contributions to the excitonic absorption
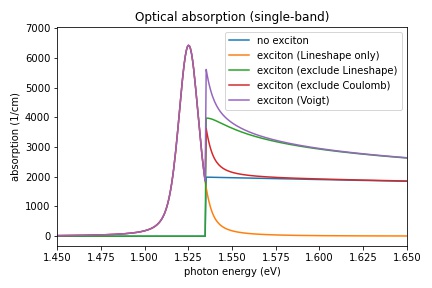
Figure 2.5.12 The absorption spectrum of a 10 nm infinite quantum well consisting of GaAs showing the different excitonic contributions. The absorption spectrum has been calculated with a Voigt broadening functions, and without excitonic contributions to the spectrum. In order to see the contributions of the Coulomb enhancement factor and the lineshape peak, each of these contributions can be switched off.
We acknowledge funding from the European Union’s Horizon 2020 research and innovation programme under grant agreement No. 101017194 (SiPho-G).
Automatic documentation: Running simulations, generating figures and reStructured Text (*.rst) using nextnanopy
— End —